And these are the good times. What happens in a recession?
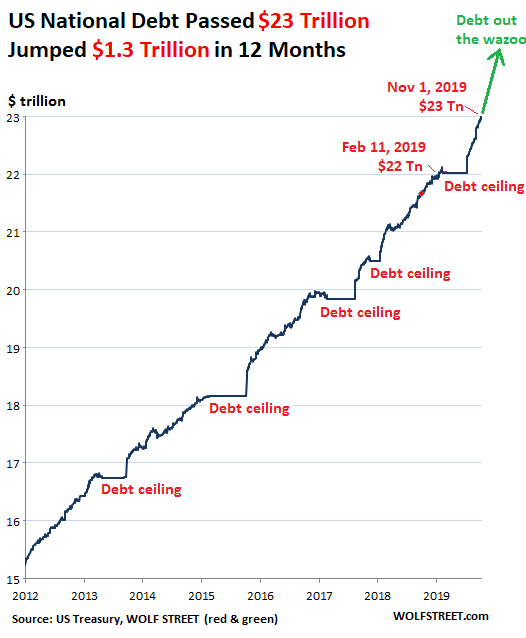
The US gross national debt – the sum of all Treasury securities outstanding – passed another illustrious milestone, $23.01 trillion, the US Treasury department disclosed on Friday. And it got there at lightning speed just eight months after having passed the illustrious milestone of $22 trillion on February 11. Over the past 12 months, the US national debt has jumped by $1.33 trillion – and these are the good times, and not a financial crisis when everything goes to heck:

The cute flat spots in the charts are periods when the US government bumped into the “debt ceiling.” The US is unique among countries in that Congress first tells the government how much to spend, what to spend it on, and in whose Congressional district to spend it in, and then on the appointed day, Congress tells the government that it cannot borrow the money that it needs in order to spend the money that Congress told it to spend. The charade, carried out regularly for political purposes to arm-twist one or the other side, leaves these flat spots behind as permanent testimony to this idiocy.
Over the 12 months through the third quarter, the US gross national debt rose by 5.6% from the same period a year earlier. But nominal GDP over the same period rose only 3.7%: meaning the growth of the debt is outrunning the growth even in what President Trump called two days ago, the “Greatest Economy in American History!”
If the growth of the federal debt outruns the economy during these fabulously good times, what will the debt do when the recession hits? When government tax receipts plunge and government expenditures for unemployment and the like soar? The federal debt will jump by $2.5 trillion or more in a 12-month period. That’s what it will do.
The growth in the US debt (the growth of Treasury securities outstanding) is the most accurate measure of the true deficit – the actual cash difference between how much cash the government takes in and how much cash the government spends. The government has to borrow the difference between the two – and that’s what the increase in the debt measures.
This increase in the debt shows the negative cash flow of the government. And it’s almost always significantly larger than the “budget deficit,” which is based on government accounting.
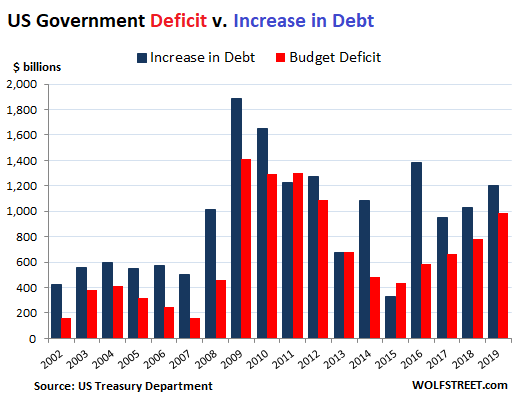
For example, in the fiscal year 2019, ended September 30, the “budget deficit” was $984 billion, according to the Treasury Department. This is a huge number, considering that these are the good times. But the government had to borrow an additional $1.2 trillion over the same period. In other words, the actual cash deficit, as represented by the increase in the debt, was $219 billion higher than the government accounting of the deficit.
And this is the case year after year. The chart below shows the increase in the debt for each fiscal year (blue column) and the “deficit” as per government accounting, going back to 2002. Over these 18 years, there were only two years when the deficit was either the same or larger than the increase in the debt. For the remaining 16 years, the increase in the debt was far larger than the deficit. In total, over those 18 years, all added together, the increase in debt has exceeded the “budget deficit” by $5 trillion:

The budget deficit – the much more benign figure, huge as it is – is what is being bandied about. Practically no one in government or the mainstream media bandies about the increase in the debt, though it is the more truthful figure that cannot be played with.
[ed. See also: What Will Stocks Do When “Consensual Hallucination” Ends? and, for head-shaking, throw up your hands incredulity, Uber Loses Another $1.2 billion, Stock Dives Again (Wolfstreet).]
The cute flat spots in the charts are periods when the US government bumped into the “debt ceiling.” The US is unique among countries in that Congress first tells the government how much to spend, what to spend it on, and in whose Congressional district to spend it in, and then on the appointed day, Congress tells the government that it cannot borrow the money that it needs in order to spend the money that Congress told it to spend. The charade, carried out regularly for political purposes to arm-twist one or the other side, leaves these flat spots behind as permanent testimony to this idiocy.
Over the 12 months through the third quarter, the US gross national debt rose by 5.6% from the same period a year earlier. But nominal GDP over the same period rose only 3.7%: meaning the growth of the debt is outrunning the growth even in what President Trump called two days ago, the “Greatest Economy in American History!”
If the growth of the federal debt outruns the economy during these fabulously good times, what will the debt do when the recession hits? When government tax receipts plunge and government expenditures for unemployment and the like soar? The federal debt will jump by $2.5 trillion or more in a 12-month period. That’s what it will do.
The growth in the US debt (the growth of Treasury securities outstanding) is the most accurate measure of the true deficit – the actual cash difference between how much cash the government takes in and how much cash the government spends. The government has to borrow the difference between the two – and that’s what the increase in the debt measures.
This increase in the debt shows the negative cash flow of the government. And it’s almost always significantly larger than the “budget deficit,” which is based on government accounting.
For example, in the fiscal year 2019, ended September 30, the “budget deficit” was $984 billion, according to the Treasury Department. This is a huge number, considering that these are the good times. But the government had to borrow an additional $1.2 trillion over the same period. In other words, the actual cash deficit, as represented by the increase in the debt, was $219 billion higher than the government accounting of the deficit.
And this is the case year after year. The chart below shows the increase in the debt for each fiscal year (blue column) and the “deficit” as per government accounting, going back to 2002. Over these 18 years, there were only two years when the deficit was either the same or larger than the increase in the debt. For the remaining 16 years, the increase in the debt was far larger than the deficit. In total, over those 18 years, all added together, the increase in debt has exceeded the “budget deficit” by $5 trillion:

The budget deficit – the much more benign figure, huge as it is – is what is being bandied about. Practically no one in government or the mainstream media bandies about the increase in the debt, though it is the more truthful figure that cannot be played with.
by Wolf Richter, Wolfstreet | Read more:
Images: US Treasury Dept. and Wolfstreet