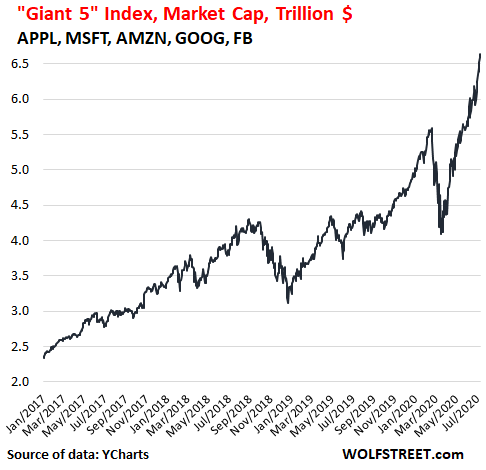
The “Giant 5” – Apple, Microsoft, Amazon, Alphabet, and Facebook – had another good day on Friday, with their combined market capitalization rising by 0.6% to another new high of $6.64 trillion, continuing a spike that started on March 16 and now measures 62.2%. In dollar terms, five stocks gained $2.54 trillion in less than four months.
Since January 1, 2017, my “Giant 5 Index” has soared by 184%, or by $4.3 trillion, with two sell-offs or crashes or whatever in between.
Even these days, when trillions fly by so fast that they’re hard to see, that’s still a huge increase in market value of just five companies in the span of three-and-a-half years (market cap data via YCharts):

The market capitalization – the number of shares outstanding times the current share price – of the Giant 5 has reached a breath-taking magnitude:
Apple [AAPL]: $1.66 trillion
Microsoft [MSFT]: $1.62 trillion
Amazon [AMZN]: $1.60 trillion
Alphabet [GOOG]: $1.05 trillion
Facebook [FB]: $699 billion.
How big are they compared to the entire stock market?
And I mean the entire US stock market, and not just the S&P 500. The Wilshire 5000 Total Market Index tracks all 3,415 or so US-listed companies. And the market cap of all those companies combined rose today to $32.47 trillion, up 44.4% from its crisis low on March 23.
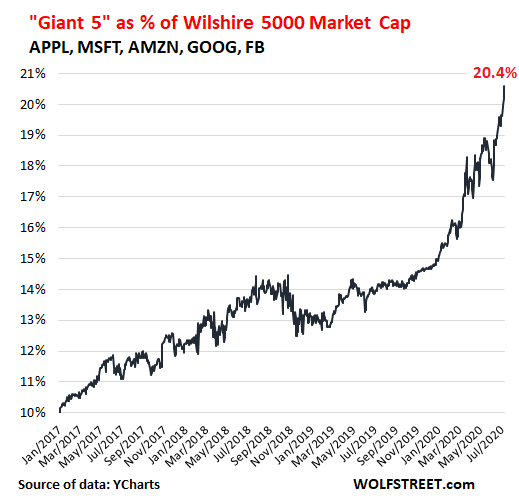
But as the shares of the Giant 5 have surged, the weight of the Giant 5 in the overall stock market has spiked from 17.5% on June 8 – that date will crop up again in a moment – to 20.4% today, and has more than doubled since January 2017, when the Giant 5 accounted for an already amazing 10% of the Wilshire 5000 (Wilshire 5000 data via YCharts):

On June 8 – here’s that date again – the stock market hit a Crisis high. The S&P 500 closed at 3,232, and the Wilshire 5000 at 32,936. As of Friday’s close, both the S&P 500 and the Wilshire 5000 remain below those June 8 levels.
But the Giant 5 Index, which was at $5.78 trillion on June 8, has since surged by 14%, to $6.6 trillion.
While the rest of the market has declined, the Giant 5 have surged. And, this surge in the Giant 5 obscured the decline in the rest of the market.
In other words, without the Giant 5, the rest of the market combined was a dud. And this is what has been happening for years!
The Market Minus the Giant 5.
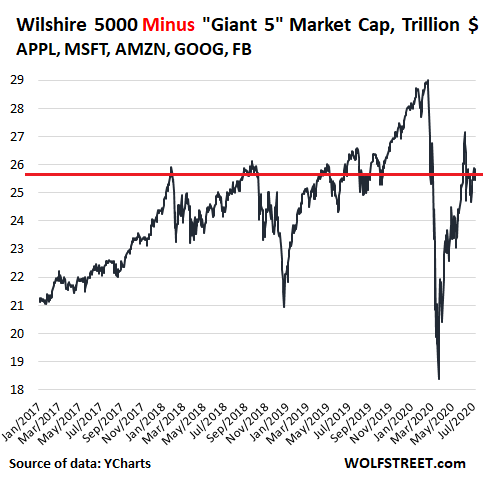
To see how the rest of the market is performing without these five stocks, I have created the “Wilshire 5000 minus the Giant 5 Index.” This shows what’s left of the entire stock market of 3,415 stocks, after removing these five giants.
The “Wilshire 5000 minus the Giant 5 Index” closed at $25,836 trillion today, still down 10.9% from the peak on February 19. Over the same period, the Giant 5 have soared 18.7%!
From the bottom in March, the “Wilshire 5000 minus the Giant 5” has surged 40.6%. The Giant 5 Index has skyrocketed 62.2%!
The “Wilshire 5000 minus the Giant 5 Index” is down 5.2% from June 8; down 10.9% from the high in February; down 1.2% from September 2018; and it’s just a tad below where it had been on January 26, 2018.
In other words, the rest of the stock market – all its winners and losers combined – without the Giant 5 and despite the horrendous volatility has gone nowhere since January 2018:

A miserable savings account would have outperformed the overall stock market without the Giant 5, and would have done so without all the horrendous volatility of the two sell-offs. Just five stocks whose market values have soared beyond imaginable magnitude pulled out the entire market.
And that’s a scary thought – that this entire market has become totally dependent on just five giant stocks with an immense concentration of power that have now come under regulatory security. And just as these stocks pulled up the entire market, they can pull down the entire market by their sheer weight.
Since January 1, 2017, my “Giant 5 Index” has soared by 184%, or by $4.3 trillion, with two sell-offs or crashes or whatever in between.
Even these days, when trillions fly by so fast that they’re hard to see, that’s still a huge increase in market value of just five companies in the span of three-and-a-half years (market cap data via YCharts):

The market capitalization – the number of shares outstanding times the current share price – of the Giant 5 has reached a breath-taking magnitude:
Apple [AAPL]: $1.66 trillion
Microsoft [MSFT]: $1.62 trillion
Amazon [AMZN]: $1.60 trillion
Alphabet [GOOG]: $1.05 trillion
Facebook [FB]: $699 billion.
How big are they compared to the entire stock market?
And I mean the entire US stock market, and not just the S&P 500. The Wilshire 5000 Total Market Index tracks all 3,415 or so US-listed companies. And the market cap of all those companies combined rose today to $32.47 trillion, up 44.4% from its crisis low on March 23.
But as the shares of the Giant 5 have surged, the weight of the Giant 5 in the overall stock market has spiked from 17.5% on June 8 – that date will crop up again in a moment – to 20.4% today, and has more than doubled since January 2017, when the Giant 5 accounted for an already amazing 10% of the Wilshire 5000 (Wilshire 5000 data via YCharts):

On June 8 – here’s that date again – the stock market hit a Crisis high. The S&P 500 closed at 3,232, and the Wilshire 5000 at 32,936. As of Friday’s close, both the S&P 500 and the Wilshire 5000 remain below those June 8 levels.
But the Giant 5 Index, which was at $5.78 trillion on June 8, has since surged by 14%, to $6.6 trillion.
While the rest of the market has declined, the Giant 5 have surged. And, this surge in the Giant 5 obscured the decline in the rest of the market.
In other words, without the Giant 5, the rest of the market combined was a dud. And this is what has been happening for years!
The Market Minus the Giant 5.
To see how the rest of the market is performing without these five stocks, I have created the “Wilshire 5000 minus the Giant 5 Index.” This shows what’s left of the entire stock market of 3,415 stocks, after removing these five giants.
The “Wilshire 5000 minus the Giant 5 Index” closed at $25,836 trillion today, still down 10.9% from the peak on February 19. Over the same period, the Giant 5 have soared 18.7%!
From the bottom in March, the “Wilshire 5000 minus the Giant 5” has surged 40.6%. The Giant 5 Index has skyrocketed 62.2%!
The “Wilshire 5000 minus the Giant 5 Index” is down 5.2% from June 8; down 10.9% from the high in February; down 1.2% from September 2018; and it’s just a tad below where it had been on January 26, 2018.
In other words, the rest of the stock market – all its winners and losers combined – without the Giant 5 and despite the horrendous volatility has gone nowhere since January 2018:

A miserable savings account would have outperformed the overall stock market without the Giant 5, and would have done so without all the horrendous volatility of the two sell-offs. Just five stocks whose market values have soared beyond imaginable magnitude pulled out the entire market.
And that’s a scary thought – that this entire market has become totally dependent on just five giant stocks with an immense concentration of power that have now come under regulatory security. And just as these stocks pulled up the entire market, they can pull down the entire market by their sheer weight.
by Wolf Richter, Wolf Street | Read more:
Images: Wolf Street